Getting Maximo Data Out: Kafka, Data Export, and CDC Patterns
🎯 Who this is for: Data engineers and integration developers who own the actual extraction pipeline, Maximo administrators being asked to "just turn on Kafka" without a clear picture of what that means, and architects who need to choose between REST, MIF, DB-direct, and federation before a single Delta table gets created.
Series: Part 2 of 6 — MAS 9 + Databricks: Building the Maximo Data Lakehouse | Read time: 17 minutes
📖 Why Extraction Architecture Is the First Real Decision
Part 1 of this series named five ceilings in MAS 9's native analytics and made the case that a lakehouse is the right tool once you hit one of them — a cross-system join Cognos can't do, a fourth report author with no seat, a custom model Predict's catalog can't cover. That case is the why. This post is the how, and it's the step most lakehouse projects get wrong first, because it looks like a checkbox — "we'll connect Databricks to Maximo" — when it's actually an architecture decision with real, different-shaped consequences depending on which pattern you pick.
Here's the trap. A team scopes a Databricks project, someone on the call says "we'll just hit the REST API," everyone nods, and six months later WORKORDER data is arriving 40 minutes stale because nobody sized the polling frequency against the table's actual change rate, or a well-meaning admin turns on Kafka broker configuration without registering a single queue, or — the most expensive version — someone asks "can we just connect straight to the database?" without knowing that question has a different answer depending on whether your MAS is cloud-managed or self-managed, and finds out the hard way three sprints into a DB-direct build that SaaS MAS seals its database by design.
None of these are exotic failures. They're the predictable result of picking an extraction pattern by vibes instead of by matching it to two questions: how fresh does this data need to be, and what does your deployment model actually allow? This post answers both, precisely, for all four patterns MAS 9 supports — with the real Maximo object structures, the real Suite Administration Kafka configuration steps, and an honest accounting of what "CDC" does and doesn't mean for a Maximo shop.
💡 Key insight: Every extraction mistake in this space traces back to skipping one of two questions — "how fresh does this actually need to be?" and "am I self-managed or SaaS?" Answer both before you write a line of pipeline code, and three of the four patterns in this post eliminate themselves immediately.
📊 The Four Extraction Patterns At a Glance
MAS 9 gives you exactly four ways to get data out for a lakehouse, and IBM's own Maximo Integration Framework documentation is specific about which components back each one. Before the deep dive, here is the honest comparison — what each pattern actually is, not what it's often assumed to be.
| Pattern | Direction | Latency | Deployment requirement | Best for |
|---|---|---|---|---|
| REST/JSON API | Pull (Databricks queries Maximo) | Minutes (polling interval you set) | Works on SaaS and self-managed | Default choice — scheduled bronze ingestion for most tables |
| MIF over Kafka / Event Streams | Push (Maximo publishes events) | Near-real-time (seconds) | Works on SaaS and self-managed, requires Kafka provisioning | High-change tables (WORKORDER, FAILUREREPORT) once polling latency becomes a real problem |
| DB-direct | Pull (Databricks queries the database) | Seconds (direct SQL) | Self-managed only — SaaS MAS seals the database | Self-managed shops that already own the DB connection and want zero Maximo-side integration configuration |
| Lakehouse Federation | Pull, no copy (live SQL pushdown) | Real-time, but re-queried live every time | Depends on exposed connection point; not guaranteed on SaaS | Ad-hoc, one-off lookups — never ML training or repeated heavy queries |
The pattern most teams underuse is the first one. REST/JSON API extraction sounds unglamorous next to "real-time Kafka streaming," but it is IBM's own recommended default specifically because it is the only pattern that behaves identically whether your MAS instance is a cloud-managed SaaS deployment or a self-managed on-prem cluster. Every other pattern has a deployment-model asterisk attached to it — Kafka needs provisioning either way, DB-direct is closed off entirely on SaaS, and Federation's availability depends on what your specific MAS deployment exposes. Start with REST, and reach for the others only when REST's polling latency or its request-per-call overhead becomes a real, named problem for a specific table.
🔌 Method 1 — REST/JSON API: The Default Pattern
Object Structures are the actual unit of extraction
The REST API doesn't expose raw database tables — it exposes Object Structures, and understanding this distinction is the difference between a clean extraction pipeline and a brittle one. An Object Structure is the integration framework's common data layer: it's one or more related business objects assembled into a single schema that defines the content of an XML or JSON message. MAS 9 ships a large catalog of predefined, standard Object Structures — MXAPIWO for work orders, MXAPIASSET for assets, MXAPIINVENTORY for inventory balances, and dozens more — each already joined to the child objects you'd otherwise have to assemble yourself with manual SQL joins. For JSON messages specifically, you can also configure message templates on an Object Structure to filter which fields from the related business objects actually appear in the payload, which matters for keeping bronze-layer JSON lean.
This matters for extraction design because it means your bronze ingestion job isn't querying WORKORDER — it's querying MXAPIWO, which already carries labor transactions, materials, and failure-report data nested under the work order record if you ask for them. Trying to reconstruct that join yourself against raw tables is both slower and a duplicate of work the Object Structure already does.
A realistic extraction query against the standard work order Object Structure looks like this:
GET https://{your-mas-host}/maximo/api/os/mxapiwo
    ?oslc.where=status="APPR" and changedate>="2026-07-17T00:00:00-00:00"
    &oslc.select=wonum,description,status,assetnum,siteid,changedate,worktype
    &oslc.pageSize=500
    &lean=1
Headers:
    apikey: {your-api-key}
The oslc.where clause is doing the delta-extraction work here — changedate>= filters to only rows touched since the last successful pull, which is the closest thing MAS 9's REST API offers to a native "give me what changed" query (more on why this isn't true CDC in a later section). oslc.select keeps the payload to only the fields your bronze table actually needs, and lean=1 strips response metadata that adds no analytical value. Pagination via oslc.pageSize matters for any table with meaningful row counts — pulling MXAPIWO without it on a mature Manage instance will time out.
Key tables and realistic extraction frequencies
Not every table needs the same polling cadence, and setting every extraction job to "every 15 minutes" either wastes API calls on slow-moving tables or under-serves fast-moving ones. Here is the extraction frequency table that should anchor your Databricks job scheduling, based on how frequently each object actually changes in a production Manage instance:
| Maximo Object Structure | Underlying data | Realistic pull frequency |
|---|---|---|
| MXAPIWO | Work orders, tasks, assignments | Every 15 minutes |
| MXAPIASSET | Asset master records | Daily |
| MXAPILOCATIONS | Location hierarchy | Daily |
| MXAPIFAILUREREPORT | Failure codes and history | Every 15 minutes |
| MXAPIMEASUREMENT | Meter and gauge readings | Every 15 minutes |
| MXAPIINVENTORY | Inventory balances | Hourly |
| MXAPIMATUSETRANS | Material usage transactions | Hourly |
| MXAPILABTRANS | Labor transactions | Hourly |
| MXAPITOOLTRANS | Tool usage | Daily |
| MXCLASSSTRUCTURE | Classification and attributes | Weekly |
| MXAPIPM | Preventive maintenance records | Daily |
The pattern to notice: transactional, technician-facing tables (MXAPIWO, MXAPIFAILUREREPORT, MXAPIMEASUREMENT) need the tightest polling because that's where your reliability analytics actually depend on freshness — a health score built on 6-hour-stale work order data is a health score describing yesterday. Reference and configuration data (MXAPIASSET, MXAPILOCATIONS, MXCLASSSTRUCTURE) changes rarely enough that daily or weekly pulls cost nothing in freshness and save real API call volume.
On the Databricks side, this maps to a straightforward pattern: a scheduled job authenticates with a Maximo API key (generated in the Administration Work Center, scoped to the minimum object structures it needs), pages through the OSLC query, and lands the raw JSON response as-is into a bronze Delta table using Auto Loader — no transformation at ingestion time, because bronze's whole job is to preserve the raw extract exactly as it arrived so you can always replay history if a downstream cleaning rule changes later.
# Illustrative pattern — REST extraction into bronze, not a literal connector
import requests
from pyspark.sql import functions as F

def pull_object_structure(base_url, api_key, os_name, where_clause, page_size=500):
    url = f"{base_url}/maximo/api/os/{os_name}"
    params = {"oslc.where": where_clause, "oslc.pageSize": page_size, "lean": 1}
    resp = requests.get(url, headers={"apikey": api_key}, params=params, timeout=60)
    resp.raise_for_status()
    return resp.json().get("member", [])

records = pull_object_structure(
    base_url="https://mas.example.com",
    api_key=dbutils.secrets.get("maximo", "api_key"),
    os_name="mxapiwo",
    where_clause='changedate>="2026-07-17T00:00:00-00:00"',
)

(spark.createDataFrame(records)
    .withColumn("_ingested_at", F.current_timestamp())
    .write.format("delta").mode("append")
    .saveAsTable("bronze.maximo_workorder_raw"))
Two details matter in that snippet beyond the obvious: the _ingested_at column is not optional — without a landing timestamp, you cannot later distinguish "this record changed in Maximo" from "this record was re-pulled because the job retried," and every silver-layer deduplication rule downstream depends on that distinction. And mode("append") rather than overwrite is deliberate — bronze is an append-only log of raw extracts by design, not a mirror of current state; deduplication and "latest version wins" logic belong in silver, not bronze.
💡 Key insight: The REST API's biggest practical failure mode isn't the API itself — it's teams who query raw business objects instead of the purpose-built Object Structure, then rebuild the joins thatMXAPIWOorMXAPIASSETalready provide. Check the standard Object Structure catalog before writing custom OSLC joins.
📡 Method 2 — MIF, Kafka, and the Data Export Framework
This is the section where terminology gets loose in most conversations, so let's be precise about the actual components, because they are not interchangeable and a Databricks architect who conflates them will design the wrong pipeline.
The integration framework's real components
The Maximo Integration Framework (MIF) is the umbrella name for the whole system, and it's built from five named components, each with one job:
| Component | What it actually does |
|---|---|
| Object Structures | The common data layer — one or more joined business objects defining an XML/JSON message schema (covered above) |
| Publish Channels | Send asynchronous messages through a message queue to an External System; triggered by an object event (insert/update/delete), an application-initiated call, or the Data Export feature |
| Enterprise Services | A pipeline for querying and importing data from an external system, synchronously or asynchronously |
| External Systems | The record that identifies the external application, its communication protocol, and which Enterprise Services, Publish Channels, and message queues it uses |
| Message Queues | Where asynchronous messages wait to be processed — four types: outbound sequential, outbound continuous, inbound sequential, inbound continuous |
For a lakehouse extraction pipeline, the piece that matters most is the Publish Channel — it's the component that actually pushes a work order or asset change out toward Databricks as an event, rather than waiting for Databricks to come ask for it. And critically: the same Publish Channel infrastructure backs both an event-driven Kafka push and the standalone Data Export feature, which is a separate, simpler mechanism worth understanding on its own.
Data Export, specifically, is a manual-or-scheduled feature available on most Maximo applications: you open the Data Export dialog, specify a SQL where-clause to filter which rows you want, set an export-count limit, and the system writes a CSV file to the flatfiles directory under the mxe.int.globaldir system property. It's genuinely useful for a one-time historical backfill into bronze — pulling five years of closed work orders once, rather than replaying five years of Kafka events that were never published — but it is not a governed, repeating pipeline the way a Kafka-backed Publish Channel is.
Configuring Kafka for MAS 9 — the real steps
If your team decides polling latency is a real problem for MXAPIWO or MXAPIFAILUREREPORT, Kafka is the answer, and it requires configuration in two separate places: the Suite Administration dashboard (the broker connection) and the Maximo Manage External Systems application (the queues and topics).
Suite Administration side — under Other configurations > Configurations > Apache Kafka, you provide:
- Six broker hostnames — one row per Kafka broker in your Event Streams service credential (for example,
broker-0-<id>.kafka.svc07.us-south.eventstreams.cloud.ibm.comthroughbroker-5-<id>...), copying the hostname only, never the port - Port — typically
9093for Event Streams - SASL Mechanism —
plain, the default for IBM Event Streams - Username / Password — from the Event Streams service credential
- Certificates — a two-part chain: the Let's Encrypt R3 intermediate certificate and the ISRG Root X1 root certificate, each added as a separate alias
After saving, the configuration takes up to 10 minutes to reconcile before its status shows Ready.
Manage / External Systems side — once the broker connection is live, you register a Kafka message provider (provider type KAFKA) with SASL_MECHANISM, SECURITY_PROTOCOL (defaults to SASL_SSL), BOOTSTRAPSERVERS, USERNAME, and PASSWORD, then register each Kafka topic as a Maximo queue — outbound sequential, outbound continuous, inbound sequential, or inbound continuous — and configure a matching Kafka cron task instance to poll it:
| Cron task property | Description | Required? |
|---|---|---|
| TOPIC | The Kafka topic name | Yes |
| MESSAGEHUB | The registered Kafka provider name | Yes |
| MESSAGEPROCESSOR | The message processor class (shares JMS defaults if unset) | No |
| PARTITION | The specific partition this cron task instance consumes | Yes for continuous queues |
The detail teams miss most often: for every continuous queue, you must also configure a KAFKAERROR cron task instance. Unlike sequential queues — where a single erroring message blocks everything behind it until you fix it, using the queue itself as an implicit error state — continuous queues keep processing past errors and write failed messages to the maxinterror error table instead. Without a KAFKAERROR instance running for that queue, those failed messages simply accumulate with nothing reprocessing them, and you won't notice until an audit turns up silently-dropped work order updates.
An outbound message published through this pipeline arrives at your Kafka topic wrapped as JSON, structured like this:
{
  "interfacetype": "MAXIMO",
  "INTERFACE": "MXWOInterface",
  "payload": "{\"wonum\":\"1425\",\"status\":\"APPR\",\"siteid\":\"BEDFORD\"}",
  "SENDER": "MX",
  "destination": "DATABRICKS",
  "destjndiname": "<kafka-topic-name>",
  "compressed": "1",
  "MEAMessageID": "<provider>~<topic>~<partition>~<offset>",
  "mimetype": "application/json"
}
Your Databricks Structured Streaming job consumes this topic directly — Kafka messages in Maximo are always byte-typed and always compressed, with a configurable size ceiling (mxe.kafka.messagesize, 10 MB by default) and a retention window set on the Kafka server itself, not deleted by Maximo on processing.
💡 Key insight: "Turn on Kafka" is at minimum a six-hostname broker configuration, a certificate chain, a registered message provider, one or more registered queues, a matching cron task per partition, and — for continuous queues specifically — a KAFKAERROR instance you will forget if nobody tells you it exists. Budget for this as real integration work, not a settings toggle.🗄️ Method 3 & 4 — DB-Direct and Lakehouse Federation
These two patterns get grouped together because they share a defining trait — both bypass the REST/Kafka integration layer entirely and talk to (or through) the database directly — but they solve different problems and carry very different constraints.
DB-direct: the pattern with a hard deployment wall
DB-direct extraction connects Databricks directly to the underlying Maximo database — through Lakeflow Connect's managed CDC connectors for Oracle or SQL Server, or through a JDBC read or third-party CDC tool for Db2, which Lakeflow Connect does not currently list as a supported source — and pulls tables with standard database-native change tracking rather than going through any Maximo API layer at all. When it's available, it's the fastest and lowest-overhead pattern on this list, because there's no REST call overhead, no message queue, and no Object Structure join logic in the way.
The constraint is absolute, not a matter of configuration: DB-direct only exists for self-managed MAS. In managed, cloud-hosted SaaS MAS, IBM explicitly seals the database — there is no connection string, no exposed port, no credential you can obtain, because the whole point of the managed offering is that IBM owns and isolates that database layer. If your organization runs self-managed MAS 9 on your own DB2 or Oracle instance and you already have a database connection with appropriate read permissions, DB-direct is a legitimate, low-friction choice. If you're on SaaS MAS — which is the majority of new MAS 9 deployments — this pattern is not a configuration problem to solve; it's off the table by design, and REST or Kafka is your actual option.
Lakehouse Federation: query without copying
Databricks Unity Catalog's Lakehouse Federation takes a different approach entirely — instead of extracting and copying data into Delta tables, it registers the Maximo database as a federated catalog and pushes SQL queries down to it live, at query time:
-- Query Maximo directly from Databricks — no ETL, no copied data
SELECT wonum, status, schedstart, assetnum
FROM maximo_federation.workorder
WHERE status = 'APPR' AND schedstart < CURRENT_DATE()
That query never touches a Delta table — every execution re-runs against the live Maximo database, through whatever connection point your MAS deployment exposes for federation. This makes it genuinely excellent for exactly one category of use: an analyst or engineer who needs a real-time, one-off answer and doesn't want to wait for a scheduled bronze pull or stand up a pipeline for a question they'll ask once.
It is the wrong tool for two specific things, and DOC5's own guidance is blunt about this: ML training data and heavy repeated analytics. Federated queries have no caching, no Delta versioning, no time-travel, and each execution adds live query load to the same database your technicians are working against — running a nightly AutoML training job as a federated query is functionally a recurring performance test against your production Maximo instance. If a question is going to be asked more than a handful of times, land the answer in a Delta table through REST or Kafka extraction instead, and let Federation stay a lookup tool.
💡 Key insight: DB-direct and Federation both bypass the integration framework, but only one of them is gated by your deployment model rather than your use case. Check "self-managed or SaaS?" before scoping DB-direct at all — it's a five-minute question that prevents a wasted sprint.
🔄 CDC Patterns for Maximo Data — What's Actually True
"We need CDC" is one of the most common asks in a lakehouse scoping conversation, and it's worth being precise about what that phrase means for a Maximo shop specifically, because the honest answer is narrower than the phrase implies.
What Maximo does not have
Change data capture, in its strict database sense, means reading a transaction log — the same internal record a database uses for crash recovery — to capture every insert, update, and delete as a stream of events, without querying application tables at all. This is how tools like Debezium or native database CDC connectors work against a database you control directly. MAS 9 does not expose this. In managed SaaS MAS, the database is sealed specifically to prevent this kind of direct access — the same seal that blocks DB-direct extraction blocks transaction-log CDC for the identical reason. Even in self-managed MAS, IBM does not document or support attaching a log-based CDC tool to the Maximo database, because schema changes, business rule logic, and validation live in the application layer, not the raw tables — a log-level insert doesn't carry the business context a downstream consumer usually needs.
What you actually get, and why it's close enough
Two real mechanisms cover the same practical ground, used together:
Delta extraction via REST. Filtering an OSLC query on changedate>= (as shown in the Method 1 query above) gives you every record touched since your last successful pull — not a transaction log, but a reliable "what changed" answer at whatever polling interval you configure. This is the workhorse pattern for most bronze tables.
Kafka's replayable event log as CDC-adjacent delivery. When a Publish Channel fires on an object event and lands a message in a Kafka topic, that message persists in the topic until Kafka's configured retention time expires — not deleted on processing, only marked past a consumer offset. That gives you something transaction-log CDC gives you and REST polling doesn't: the ability to replay a specific window of changes from any offset if a downstream silver-layer bug corrupted a day's worth of processing, without re-querying Maximo at all.
Neither mechanism captures deletes as cleanly as true log-based CDC does — a deleted work order simply stops appearing in your next REST pull rather than arriving as an explicit delete event, unless the Publish Channel is specifically configured to emit delete events (which the integration framework does support as one of its three object-event triggers). Design your silver-layer logic to handle "record present in old bronze snapshot, absent in new one" as an implicit delete signal if hard deletes matter to your use case.
Landing deltas with Databricks' AUTO CDC APIs
Once you have a delta stream — from either REST polling or Kafka — Databricks Lakeflow's AUTO CDC APIs handle the slowly-changing-dimension logic of applying it to a target table, so you're not hand-writing merge logic for every bronze-to-silver promotion:
from pyspark import pipelines as dp
from pyspark.sql.functions import col

@dp.view
def workorder_changes():
    return spark.readStream.table("bronze.maximo_workorder_raw")

dp.create_streaming_table("silver.workorder_current")
dp.create_auto_cdc_flow(
    target="silver.workorder_current",
    source="workorder_changes",
    keys=["wonum", "siteid"],
    sequence_by=col("changedate"),
    stored_as_scd_type=2,   # keep full history — track every status change over time
)
Setting stored_as_scd_type=2 here is a deliberate choice for work order data specifically: it preserves every historical status transition with __START_AT/__END_AT validity windows rather than overwriting in place, which matters if a downstream gold-layer metric — PM effectiveness, backlog aging — needs to reconstruct "what was this work order's status on any given day," not just its current state. For reference tables like MXAPIASSET, where you usually only care about current values, stored_as_scd_type=1 is the simpler, cheaper choice.
💡 Key insight: Say "delta extraction plus replayable Kafka events," not "CDC," when you're scoping a Maximo lakehouse project internally. It's a five-word difference that prevents a stakeholder from expecting transaction-log guarantees a sealed SaaS database structurally cannot provide.
🧱 Landing Into Delta Lake Bronze
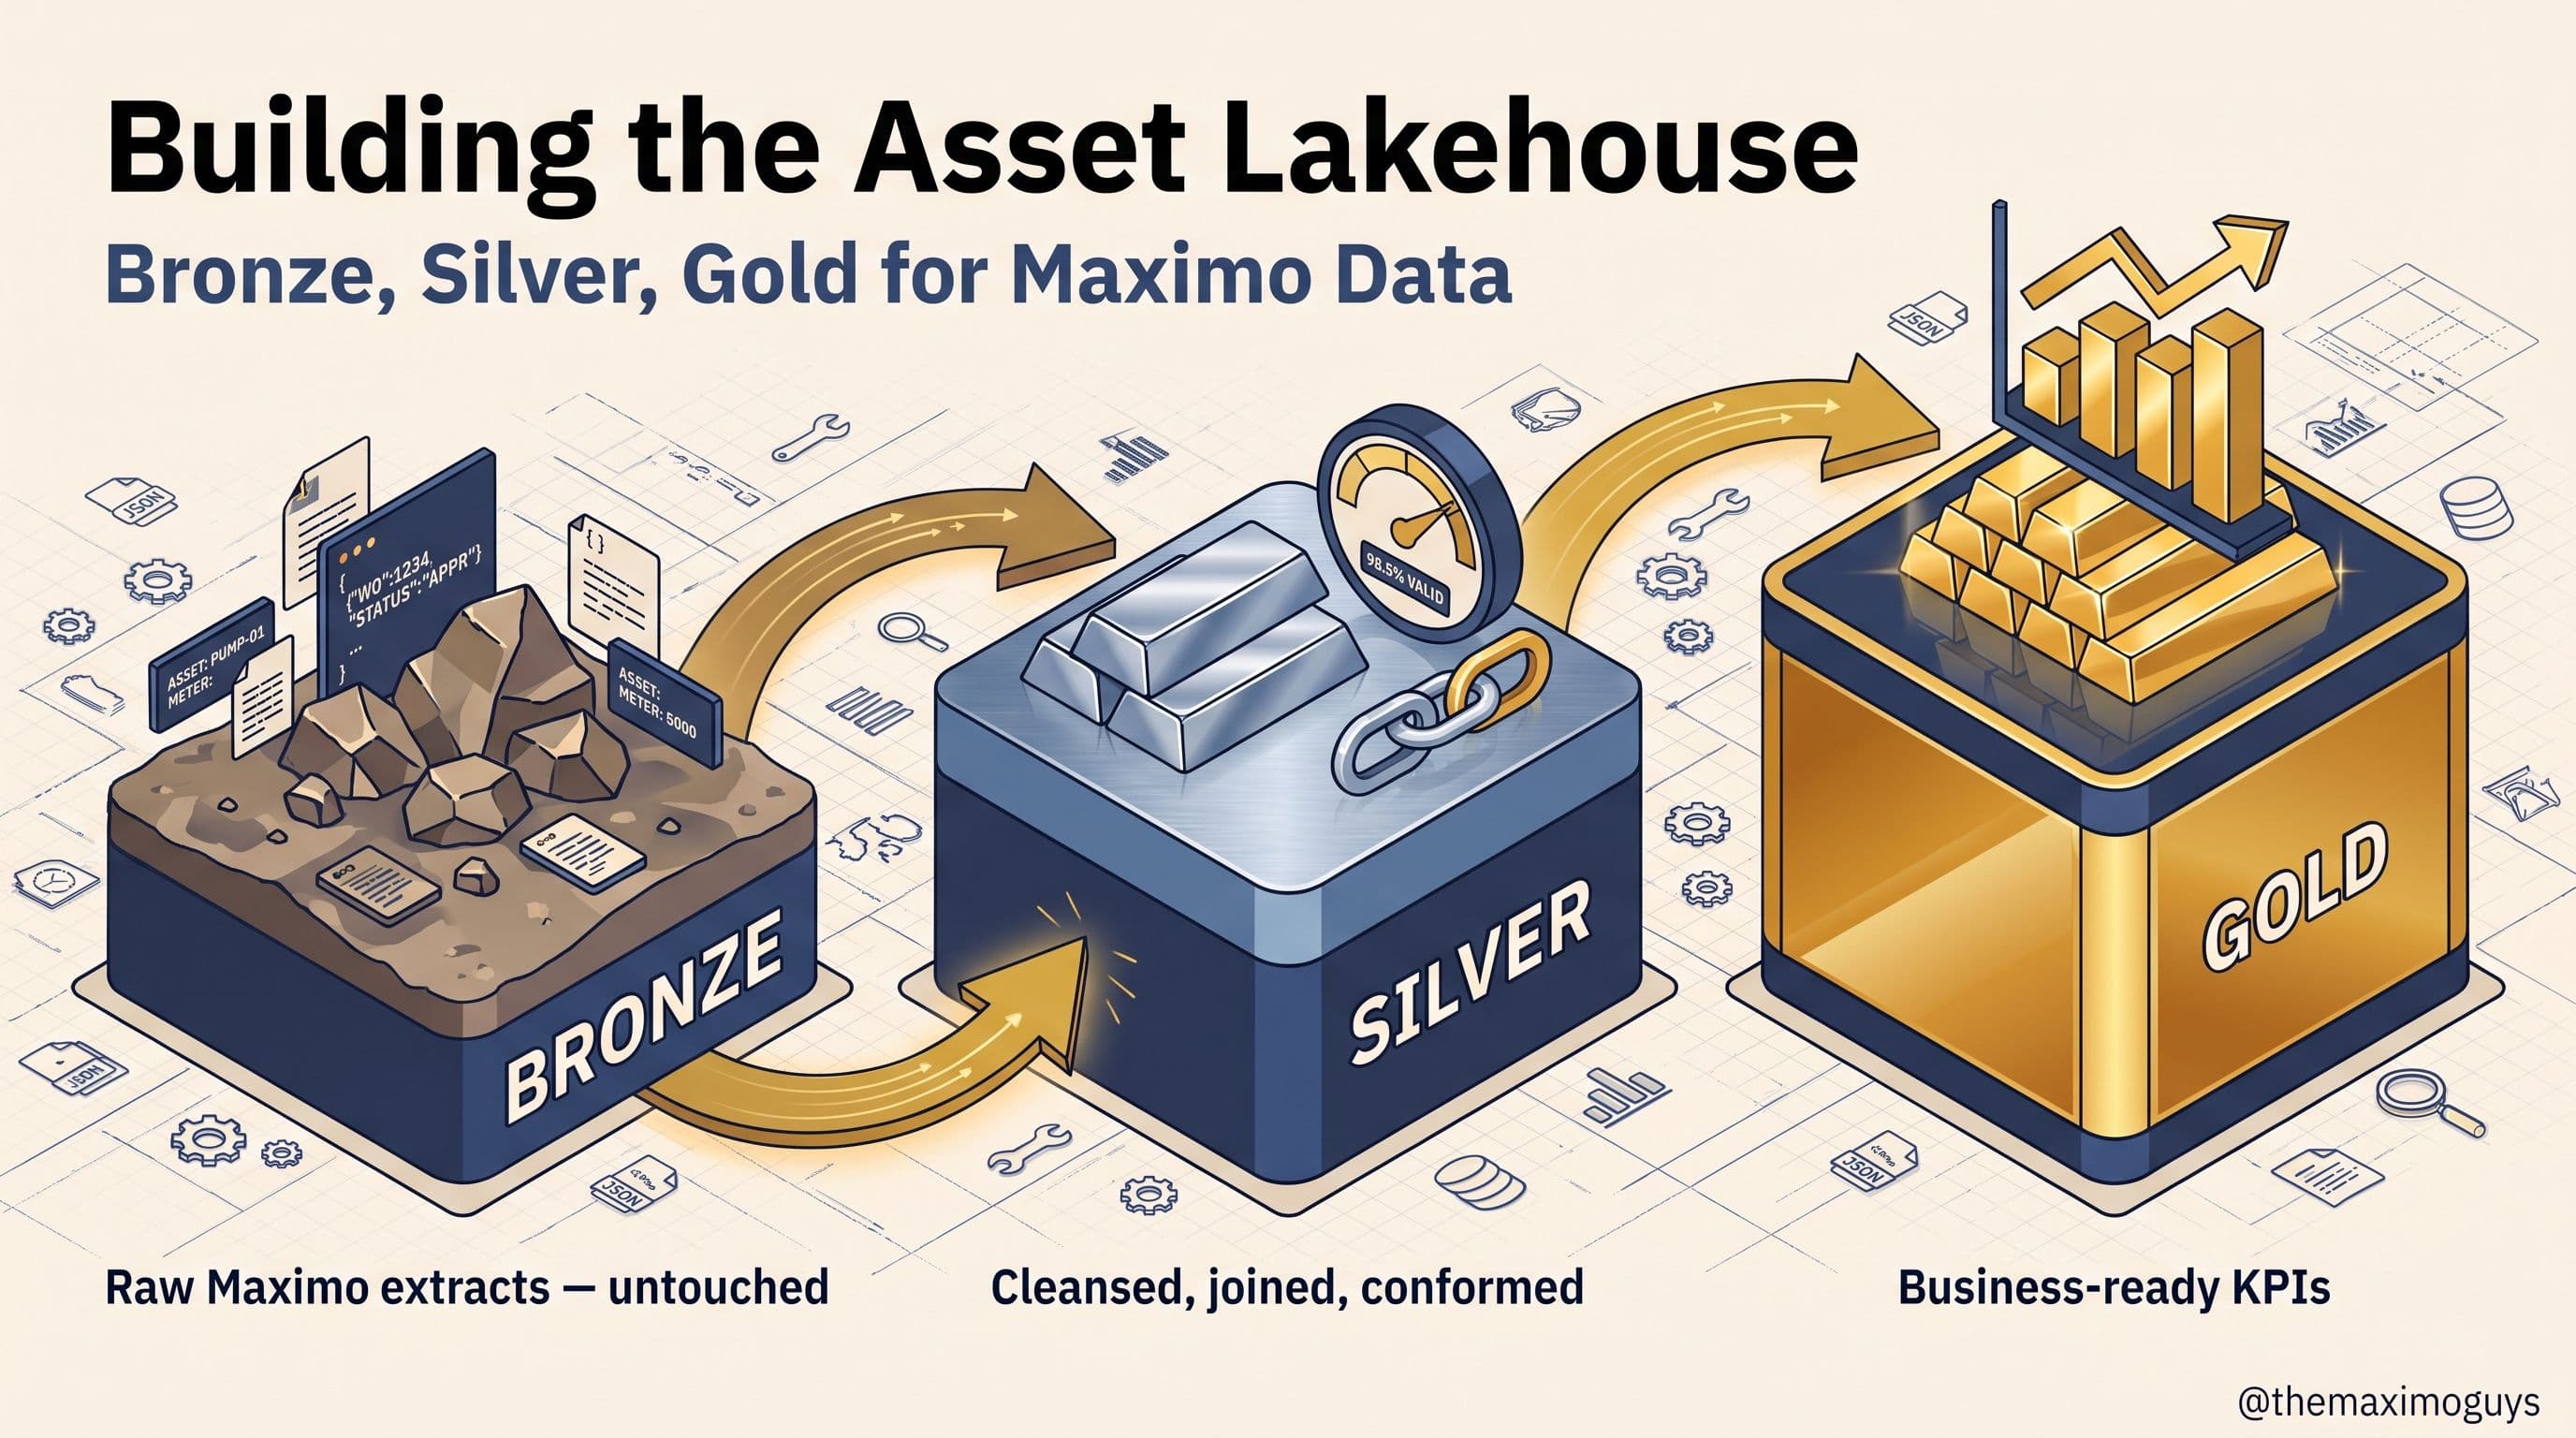
Whichever pattern (or combination) you pick, bronze's job is unchanged: hold the raw extract exactly as it arrived, untransformed, so any downstream rule change can be replayed from source truth instead of re-extracted from Maximo. Here's how the four extraction patterns map onto a realistic bronze layer for a MAS 9 + Databricks build:
| Bronze table | Source pattern | Format | Landing frequency |
|---|---|---|---|
| bronze.maximo_workorder_raw | REST (MXAPIWO) or Kafka Publish Channel | JSON → Delta | Every 15 min (REST) or near-real-time (Kafka) |
| bronze.maximo_asset_raw | REST (MXAPIASSET) | JSON → Delta | Daily |
| bronze.maximo_failurereport_raw | REST or Kafka | JSON → Delta | Every 15 min |
| bronze.maximo_measurement_raw | Kafka (IoT-instrumented) or REST | JSON/Avro → Delta | Near-real-time or every 15 min |
| bronze.maximo_inventory_raw | REST (MXAPIINVENTORY) | JSON → Delta | Hourly |
| bronze.maximo_matusetrans_raw | REST | JSON → Delta | Hourly |
| bronze.maximo_historical_backfill | Data Export CSV (one-time) | CSV → Delta | Once, at pipeline stand-up |
Two of these rows are worth calling out specifically. First, MXAPIMEASUREMENT is the one table on this list where Kafka genuinely earns its complexity over REST polling by default, not as a later optimization — if your assets are IoT-instrumented through Maximo Monitor, sensor readings arrive at a cadence REST polling was never designed to match, and the real-time pipeline looks like Sensors → MQTT/Kafka → Databricks Structured Streaming → bronze, with rolling averages and rate-of-change calculations computed in silver, not bronze. Second, bronze.maximo_historical_backfill is the Data Export feature's actual job in this architecture — a one-time CSV load to seed history that neither REST's forward-only polling nor Kafka's forward-only event stream can retroactively provide, since neither pattern replays events that were never published or extracted in the first place.
🔍 A Worked Example: Choosing the Pattern for Three Real Scenarios
Architecture advice is easiest to apply against concrete cases. Here's how the decision actually plays out for three organizations with different constraints.
| Scenario | Deployment | Freshness need | Right pattern |
|---|---|---|---|
| Utility with cloud-managed SaaS MAS, wants nightly cost rollups | SaaS (sealed database) | Daily is fine | REST/JSON API, daily/hourly schedule per table — DB-direct is not available, and Kafka's complexity isn't justified by the freshness need |
| Manufacturer with self-managed MAS, IoT-instrumented assets, wants sub-minute anomaly detection | Self-managed | Near-real-time for MXAPIMEASUREMENT | Kafka for measurement/failure data; REST for slower reference tables (MXAPIASSET, MXAPILOCATIONS); DB-direct is available but adds no value over REST for this use case |
| Consultant needs a one-time answer to "how many open CM work orders per site" for an executive review tomorrow | Either | Real-time, one query, never repeated | Lakehouse Federation — standing up a bronze pipeline for a single question is pure overhead; a federated SQL query answers it in minutes with zero pipeline to maintain afterward |
Notice that none of these three scenarios chose Kafka as a default — only the IoT-instrumented manufacturer needed it, and specifically for the two tables (MXAPIMEASUREMENT, MXAPIFAILUREREPORT) where sub-15-minute freshness has real operational value. That's the discipline this whole post is built around: match the pattern to the freshness requirement and the deployment constraint, not to which pattern sounds most sophisticated in a planning meeting.
⚠️ Common Mistakes When Extracting Maximo Data
- Querying raw business objects instead of standard Object Structures. Rebuilding the joins
MXAPIWOorMXAPIASSETalready provide wastes engineering time and produces a schema that drifts from IBM's own predefined content on the next upgrade. - Setting every REST pull to the same frequency. Polling
MXAPILOCATIONSevery 15 minutes wastes API quota; pollingMXAPIWOdaily produces stale reliability metrics. Match frequency to the table's actual change rate, per the table above. - Registering a continuous Kafka queue without its matching `KAFKAERROR` cron task. Failed messages accumulate silently in the
maxinterrortable with nothing reprocessing them until someone notices missing data downstream — often weeks later. - Scoping DB-direct before confirming self-managed vs. SaaS. This is a five-minute question that, skipped, costs a full sprint of wasted pipeline design against a database connection that was never going to exist.
- Using Lakehouse Federation as a recurring ETL substitute. Every federated query re-executes live against production Maximo; a "temporary" federated view that becomes a daily dashboard source is a permanent, uncached load on your operational database.
- Calling delta extraction "CDC" in a stakeholder-facing scoping doc. It sets an expectation — transaction-log-level guarantees, every delete captured explicitly — that a sealed SaaS database cannot structurally deliver, and the gap surfaces at the worst time: during a data-quality incident review.
🔧 Practical Notes Before Part 3
- Start with REST-only bronze tables. Prove the medallion pipeline end-to-end with the simplest extraction pattern before adding Kafka's operational overhead for the one or two tables that actually need it.
- Generate API keys scoped to the minimum Object Structures needed. A single broad API key with access to every Object Structure is a larger blast radius than most Databricks pipelines require.
- Treat the Kafka broker configuration as infrastructure, not a Maximo setting. Six hostnames, a certificate chain, and SASL credentials belong in your platform team's runbook, with the same rigor as any other production message broker.
- Land Data Export's CSV output once, then stop using it as an ongoing pattern. It has no delta-filtering mechanism built for repeat use — it's a backfill tool, not a pipeline.
- Bring your table list to Part 3 already tagged by extraction pattern. Knowing "
MXAPIWOarrives via Kafka,MXAPIASSETarrives via daily REST" makes the medallion architecture's bronze-to-silver mapping in Part 3 a much shorter conversation.
Key Takeaways
- REST/JSON API against standard Object Structures (MXAPIWO, MXAPIASSET) is the default extraction pattern — it works identically on sealed SaaS MAS and self-managed MAS, and this post's frequency table should anchor your Databricks job scheduling.
- The integration framework's real components are not interchangeable — Object Structures, Publish Channels, Enterprise Services, External Systems, and four distinct message queue types each do one specific job, and Data Export's CSV output is a backfill tool, not a repeating pipeline.
- Kafka configuration is real infrastructure work — six Suite Administration broker hostnames, a certificate chain, registered queues, and a
KAFKAERRORcron task for every continuous queue, not a settings toggle. - DB-direct is gated absolutely by deployment model — available only for self-managed MAS, structurally unavailable on sealed SaaS MAS — while Lakehouse Federation is a live, uncached, ad-hoc lookup tool that should never carry ML training or recurring analytics load.
- Maximo has no native transaction-log CDC — the honest, practical substitute is REST delta extraction filtered on
changedateplus Kafka's replayable event log, landed with Databricks' AUTO CDC APIs for SCD Type 1/2 handling in silver.
References
- IBM Support — Using REST API Details
- IBM Support — RESTing with Maximo
- IBM Maximo REST API Guide — Selecting Fields and Filtering
- IBM Documentation — Data Import and Export with REST API (Maximo SaaS)
- MaximoDev — Syncing Data with an External System Using a Publish Channel
- Databricks — The AUTO CDC APIs: Simplify Change Data Capture with Pipelines
- Databricks — Lakehouse Federation, Connect to External Databases and Catalogs
Series Navigation
| Previous: | Part 1 — Why Your Maximo Data Belongs in a Lakehouse |
|---|---|
| Next: | Part 3 — Building the Asset Lakehouse |
About TheMaximoGuys: We help Maximo developers and teams navigate the move to MAS 9 with practical, no-hype guidance grounded in how the platform actually behaves.
Published by TheMaximoGuys | July 2026

 Surendra Katta